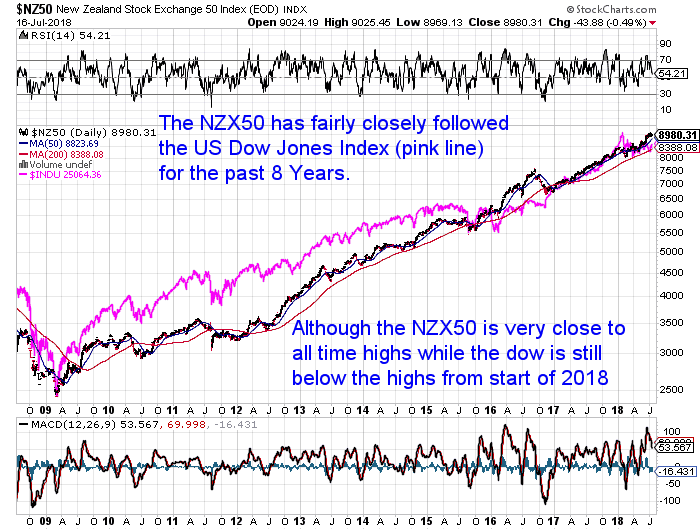
The New Zealand share market index, the NZX50 reached a new all time high earlier this month of 9084.04. Today the index is only just down from all time highs at 8953. So surely this is an indicator of a robust economy? And given share markets are meant to be forward thinking, a sign that more boom times are still ahead right? Of course there have been business confidence surveys out showing a sharp fall in recent months. But these are only measures of confidence right? It’s just these business owners over reacting to a change in government isn’t it? Because the Dow Jones is also not too far from its all time highs. So the US economy must be doing okay too mustn’t it?
All of the above seems to stack up. However out today is another New Zealand business survey, the Performance of Services Index [PSI]. And this one is based upon actual manufacturing numbers, not merely a survey of business sentiment.
What is the Performance of Services Index [PSI]?
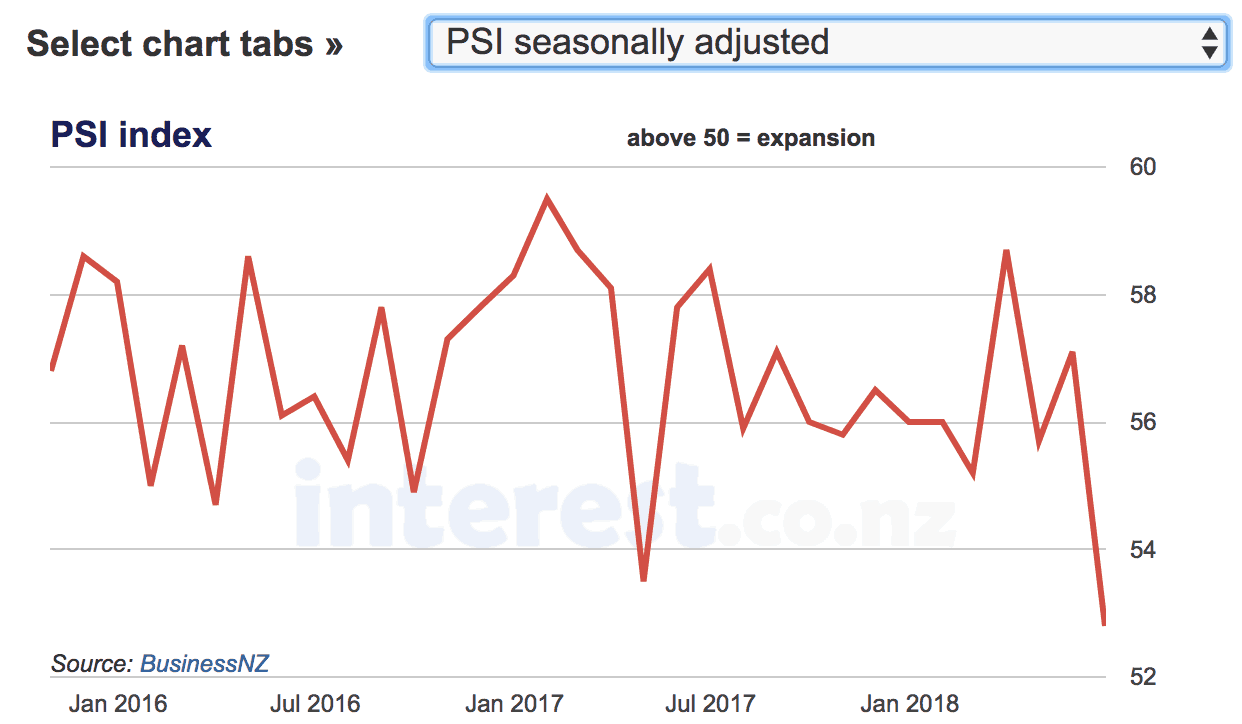
“The Performance of Services Index is a monthly survey of the New Zealand services sector providing an early indicator of activity levels. It is produced by Business NZ. …A PSI reading above 50 points indicates manufacturing activity is expanding; below 50 indicates it is contracting. The methodology of this series is based on that developed by The Institute for Supply Management in the USA who have been doing their surveys since 1931. Similar, consistent versions are published in many countries. Because of the background and technical methodology, this data is a highly regarded basis for assessing the state of manufacturing.” Source.
The PSI is a real measure of economic activity as opposed to just business confidence. And it shows a marked slowing over the past month and year, falling to 52.8 in June. Still indicating expansion but at a much slower rate than previously.
On top of this the employment index dropped below 50 to 48.9.
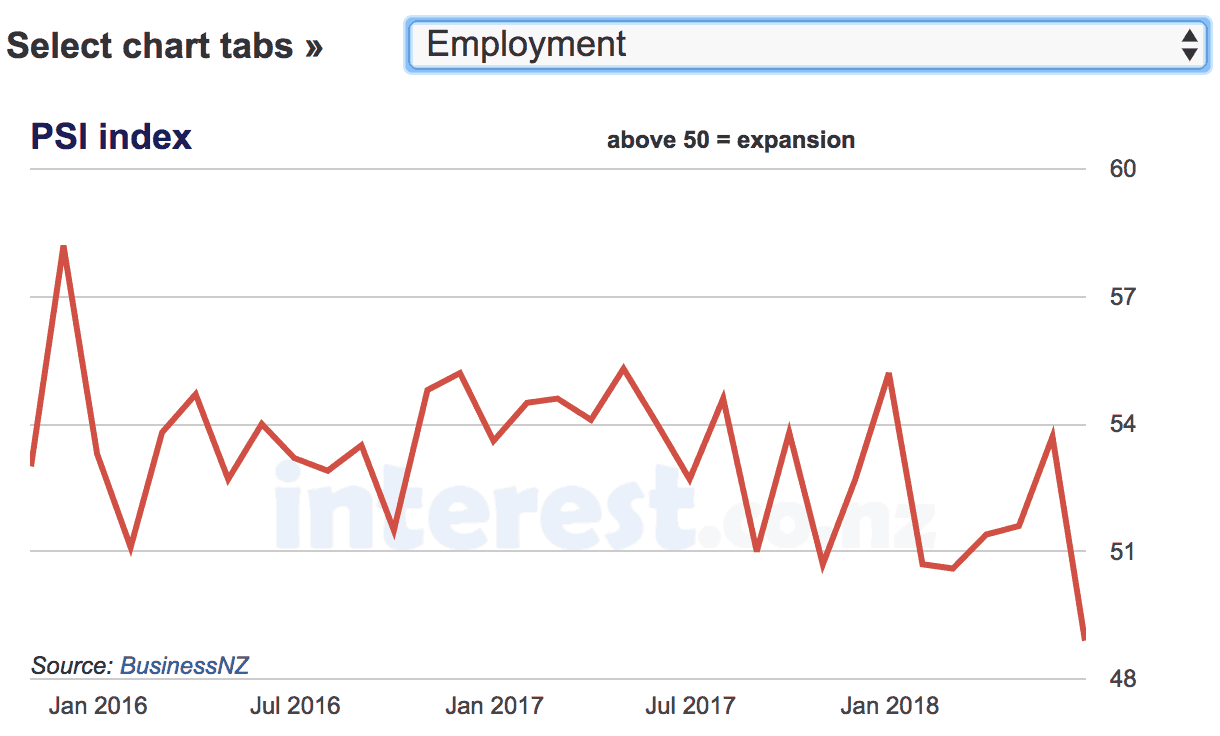
“June’s result is the lowest PSI reading since December 2012. [It is the lowest June level since 2009.] Stalling employment is another growth warning signal. Meanwhile, previously super strong new orders have peeled back too, but, at 58.6, they are still reasonable at around their long term average.”
So What Might These Business Survey Results Mean?
BNZ economist Doug Steels notes it may be a growth warning signal:
“May strength followed by June weakness could just be monthly noise rather than a pointer to a sustained period of slower growth. But we are wary of dismissing June’s weakness out of hand, given the PSI is not usually that volatile and the weaker result echoes last week’s softer Performance of Manufacturing Index (PMI). While some have discounted weak business confidence readings of late, the PSI and PMI results are not so easily dismissed as these are surveys of business outcomes not based on sentiment, outlooks, or expectations. In this sense, they are arguably more worrying from a growth perspective.” Source.
So the bottom isn’t necessarily about to drop out of the New Zealand economy tomorrow. But these numbers point to a definite slow down starting. Also while the US and NZ share markets are near their all time highs, there are many others particularly in Asia which have been slowing lately.
“Emerging markets in general, equity markets in China, Hong Kong, Singapore, and South Korea in particular, copper, and US 10-year treasury yields, are all telling you to be much more cautious about the state of the global economy.”
The Chinese share market is actually down more than 20% from its January high.
Flattening Yield Curve Also a Warning
We’ve also seen more reporting of late on the flattening yield curve. A result of falling 10-year US bond yields and rising yields on the two-year note. The yield curve flattens due to long-term bond investors seeing an economic slowdown (which therefore pushes bond prices up and sends yields lower) versus the reality of the Federal Reserve raising cash rates. The idea is that when the yield curve inverts trouble is not far ahead. The Daily Reckoning commented on recent marketwatch and Bloomberg reports: “Remarkably Accurate” Market Indicator Predicts “Devastating Losses”. They note that “since 1955, this market indicator has accurately predicted every recession”. We covered the yield curve in depth back in March and its impact on the gold price. So check that our for more detail on this important indicator: The Yield Curve Recession Predictor: Impact on Gold? The flattening yield curve seems to be gaining more widespread coverage now. This appeared in the Epoch Times earlier this week: Yield Curve Inversion Spells Trouble for Financial System – As levered players get squeezed, gold offers protection.
Golden Financial Insurance Offers Protection
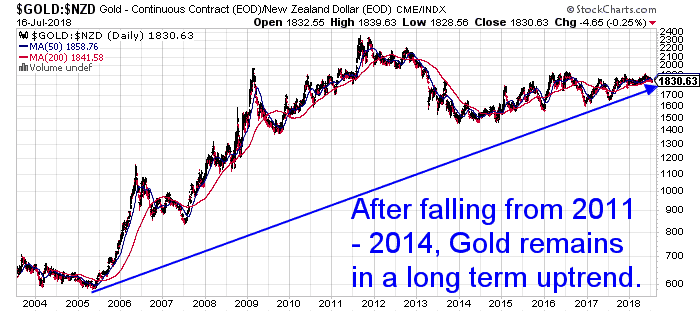
As the above Epoch Times article says says “gold offers protection”. Gold is financial insurance against uncertainty and future possible risks. Gold remains off the radar and pretty despised. Yet despite falling from 2011 – 2014, Gold in NZ dollars still remains in a long term uptrend.
Gold Still in a Long Term Uptrend
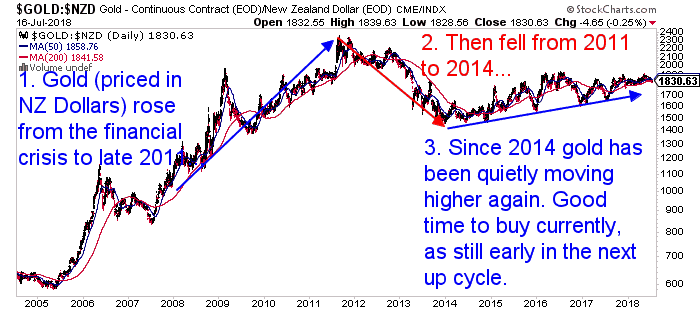
NZD Gold – 3 Cycles Since 2004: Bull – Bear – Bull
Positives for Gold
Greg Canavan succinctly summarised the positives for gold earlier this week despite sitting right on the long term uptrend line:
“Gold is now in ‘oversold’ territory on the weekly chart. That means the market is out of balance and should be due for a rally soon. Also, gold is out of balance in the futures market. Short positions keep piling up. In the ‘managed money’ segment, which is a great barometer for financial sentiment, traders are now ‘net short’ on gold for the first time since January 2016, right when the bull market got underway. There are a few reasons to think, then, that gold could be about to rally. It’s just lacking a spark…a catalyst. And right now, I’m struggling to see what that could be. This could be a good contrarian sign. When it’s not at all obvious that an asset could increase in value, it means no good news is priced in. So keep an eye on gold, it could be about to rally sharply.”
Source: moneymorning.com.au
Gold Miners to Lead Gold Higher?
Another positive we’ve noticed lately is the performance of the gold miners. Generally the miners amplify gold’s performance. But despite the recent fall in gold, the miners are holding up pretty well.
Miners (GDX) Holding up Better Than Gold

While gold is back to the lows of late 2017, miners shown by the GDX index are actually up slightly so far in 2018. So the miners could be leading gold higher.
A Final Reason for New Zealanders to Hold Gold
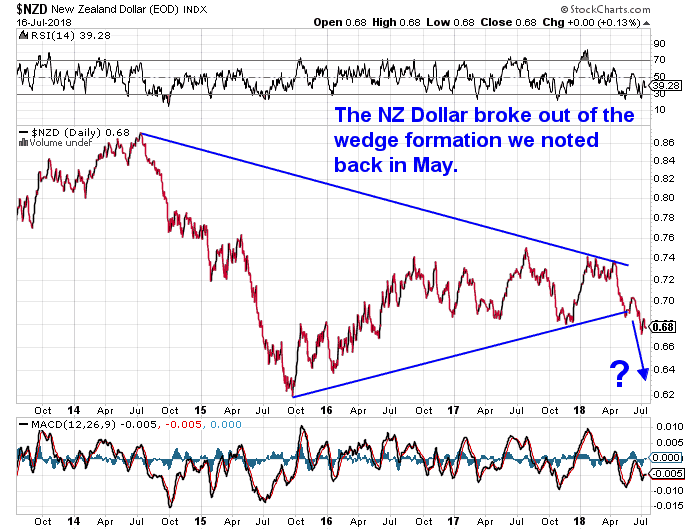
The New Zealand Dollar looks to be in a longer term downtrend. It broke down from the wedge we noted back in May. Gold can offer protection against devaluation in the Kiwi Dollar.
So far the weakness in the USD gold price has put the brakes on the gold in NZ dollars breakout we postulated back in May. But if gold does rally soon and the Kiwi dollar remains in this longer term downtrend, we could yet see some sharp upside ahead before years end. A recession is inevitable and long overdue. The trouble is knowing exactly when it will arrive. So ensure you have your golden financial insurance now as protection. Buy gold today.Learn more:When to Buy Gold or Silver: The Ultimate Guide
Pingback: New Zealand in the News Around the World - For All the Wrong Reasons - Gold Survival Guide
Pingback: NZ Dollar Falls - Why is the NZ Dollar Weaker and Where to Now? - Gold Survival Guide
Pingback: Is Now a Good Time Buy Gold in New Zealand? - Gold Survival Guide