USD Gold just broke above the key level of US$2200 reaching another new all time high on Friday night. Just under a month ago it broke above $2100, setting what was then a new all time high. What happens now?
Table of contents
Estimated reading time: 9 minutes
Prior to this breakout, gold had attempted to break through this overhead resistance just below $2100 six times since 2020.
But now that the breakout has occurred, gold in USD has set multiple new all time highs. Surging over $170 higher in the last few weeks.
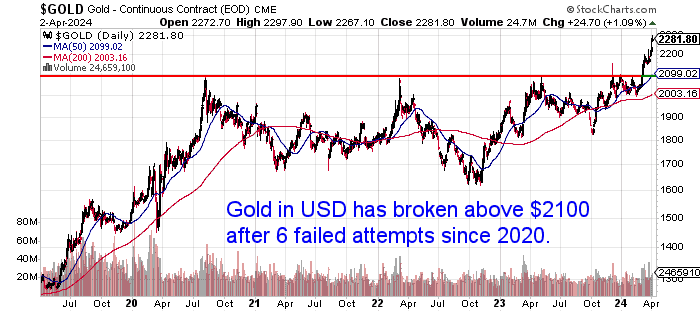
It is the USD gold price that attracts all the headlines. Therefore this US$2200 level will push gold into the financial news a little more.
Significantly gold is also at new all time highs in pretty much every other major currency.
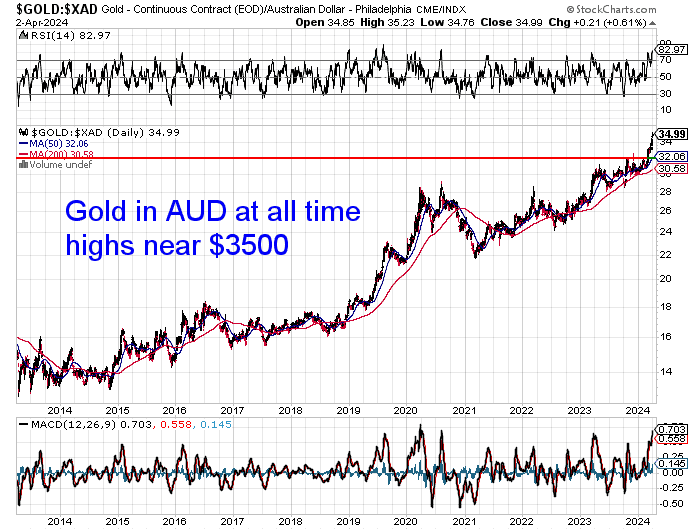
In Australian Dollars, gold is at an all time high…
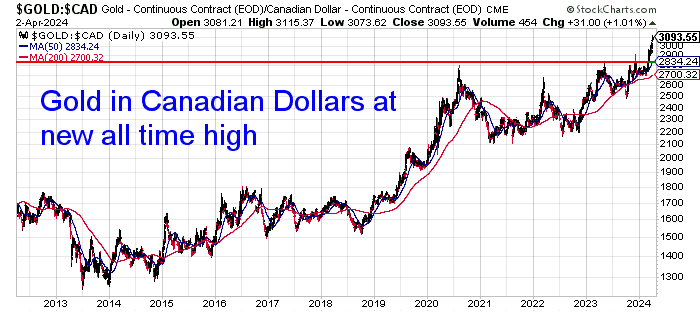
In Canadian Dollars gold has also set new all time highs…
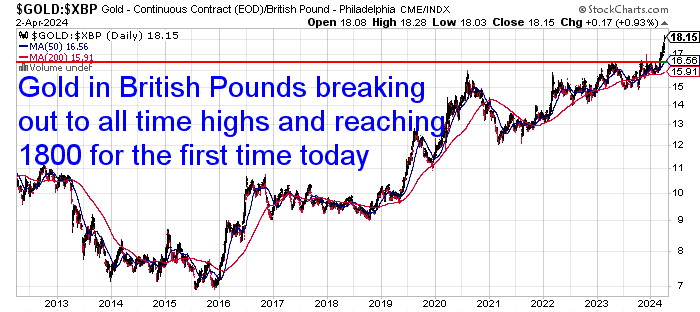
In British Pounds, Gold is also at an all time high…
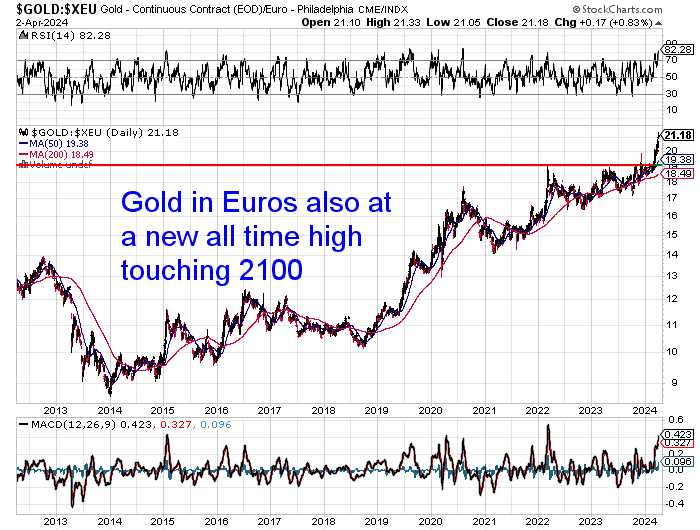
Gold is at a new all time high in Euros…
In Japanese Yen, gold has been marching higher every year after the 2021 pullback. But it is breaking even higher now too…
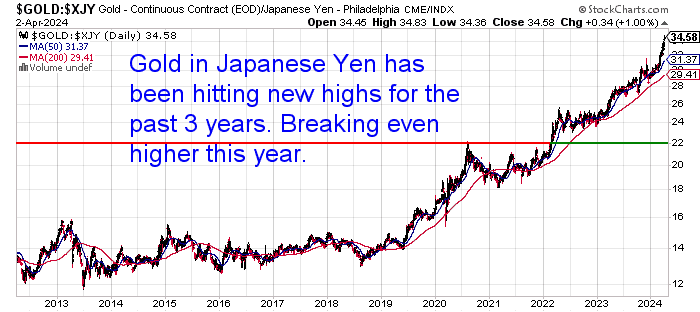
Gold in most of these other currencies hit post 2020 highs during 2023. But to repeat: It is the USD gold price that attracts attention.
What Happens Now That Gold Has Broken Out?
Now gold is above US$2200 we should see more interest in gold. The fact that gold has hit a new all time high in US dollars means we should see attention from the momentum buyers. So hedge funds and institutional investors may start to show some interest. These are the buyers that often drive the gold price.
Investors now believe the first interest rate cut may not be too far off in the US. After US inflation numbers looked somewhat mild compared to the numbers we have seen over the last couple of years. Even though things aren’t looking too bad yet in the US economy. The rising gold price is likely forecasting the next round of inflation that could be unleashed by interest rate cuts.
There are some early indications that bigger “smart money” is moving towards gold. However we are yet to see a serious pick up in money flows.
First Though We Might Soon See a Correction
USD gold is back in serious overbought territory. The RSI overbought oversold indicator is at 79. Anything above 70 is considered overbought. Earlier in March the RSI was even higher. It only pulled back slightly before once again jumping into overbought territory with the latest all time high in price.
So before too long we should see a pullback. Maybe even all the way back to retest the break out area round $2100?
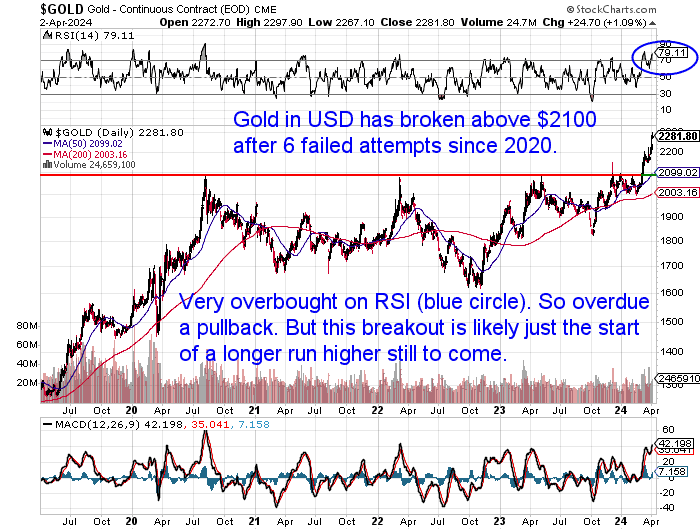
However these momentum buyers could well push gold a bit higher yet before any correction sets in.
A correction will be healthy and allow gold to move higher from here.
How high?
Well, with USD Gold already at all time high prices there are no overhead resistance levels we can look at.
However, we can look back to 2019 for some possible guidance. This was when this article was originally written, on the topic of gold breaking out after also failing 6 times previously. Following this breakout we saw USD gold move from $1400 to just under $2100 a little over a year later. This was a move of almost 50% higher.
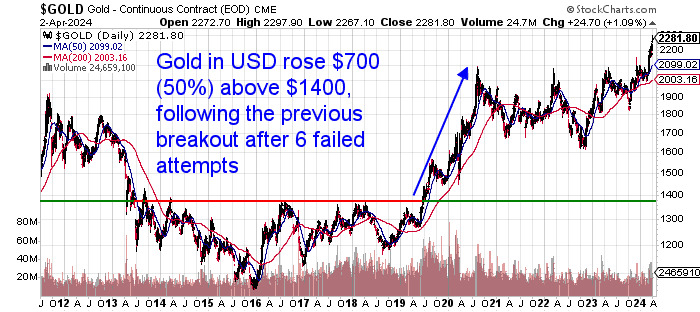
Of course there are no guarantees that history will repeat. But the set up is remarkably similar. A move of 50% this time would take the USD gold price up to somewhere in the vicinity of US$3150.
Contrarian Indicator – Low Level of Buying
However in the western hemisphere there is still very little retail interest in gold.
The Perth Mint’s gold and silver sales rebounded significantly in February, but this was only compared to January, which is often one of the slowest months. Their gold sales were still down 10% from a year ago and silver sales were down 32%.

The U.S. Mint gold sales also remain fairly lacklustre in early 2024.
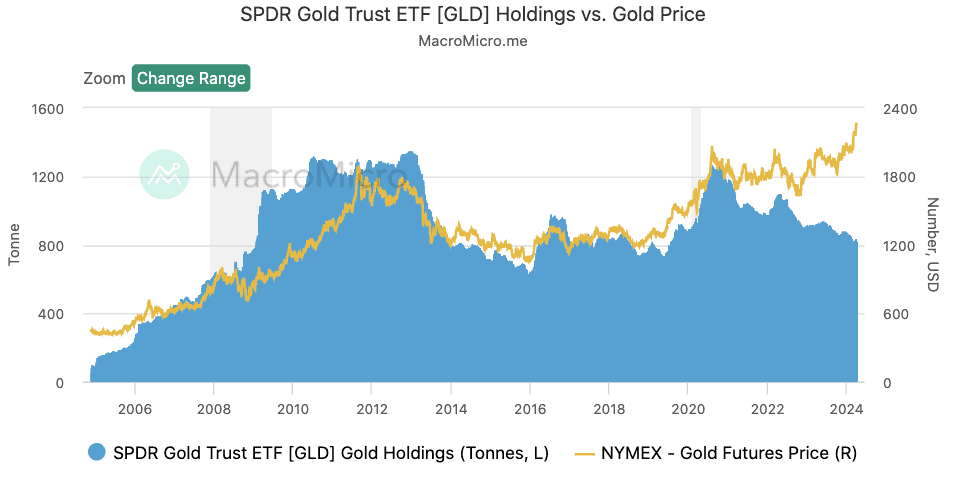
Meanwhile the SPDR Gold-backed ETF [GLD] gold holdings continue falling even while the gold price rises. This trend has been in play over the past few years, clearly showing a disinterest in gold from institutional investors.
On the flip side this jump in price has seen a significant pick up in people selling their gold. Both here in New Zealand and also overseas we have sellers outnumbering buyers 2 to 1.
We know from experience that a bull market likes to run with as few people on board as possible. So our guess is we will now see a very strong push higher in gold.
What About NZ Dollar Gold?
We usually say you should ignore the USD gold price when buying gold in New Zealand.
However at key times like this we do look at the USD gold price. As the USD gold price is now likely to lead the gold price in all other countries even higher.
So Where to From Here for NZD gold?
When gold broke out to a new all time high just above $NZ$3500 in early March, we were watching for a bit of a pullback then. Instead we have seen the price continue to power higher and as we write it now it has today broken above $3800. We should have seen this coming really. As when these major breakouts happen, we often see gold (and silver) run much higher before any pullback. Bull markets can be tricky beasts, and so price action like this also works to eventually suck people in, as the anticipated pullback doesn’t happen. Only to see a sharp pullback then take place!
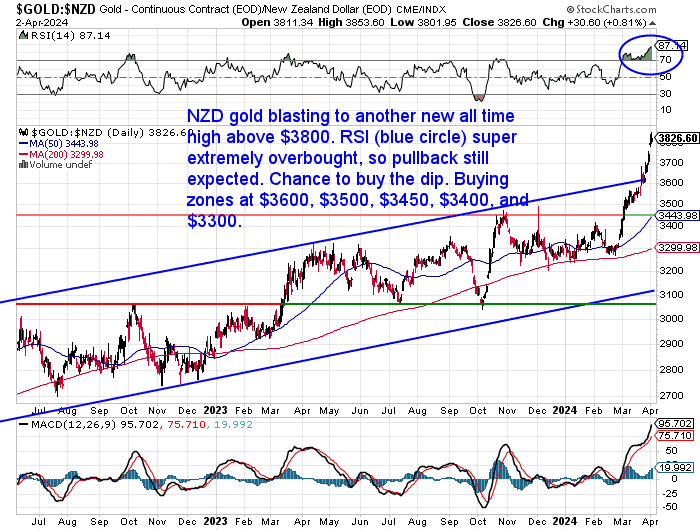
NZD gold is now starting to look quote parabolic and so a pullback is really overdue. Especially with the RSI overbought/oversold indicator (blue circle) now at 87. Anything above 70 is overbought.
The pullback could be back to $3600 – the upper line in this uptrend channel. Or even a retest of the horizontal breakout line at $3450.
But we have our doubts whether we will see prices much below $3450 again – maybe ever again. This breakout line is now likely to become support.
(Does this talk of support and resistance have you confused? Then check out: Gold and Silver Technical Analysis: The Ultimate Beginners Guide Updated)
Why Silver Remains Our Best Buy
What about silver in NZD?
Silver has certainly remained gold’s poor cousin.
In recent times silver has been looked at as an industrial metal. But that may finally be about to change.
When it does silver will go into serious catch up mode with gold.
But for now while silver is rising, it continues to lag gold. Today the gold silver ratio remains at the top of this wedge or pennant formation, just below 90.
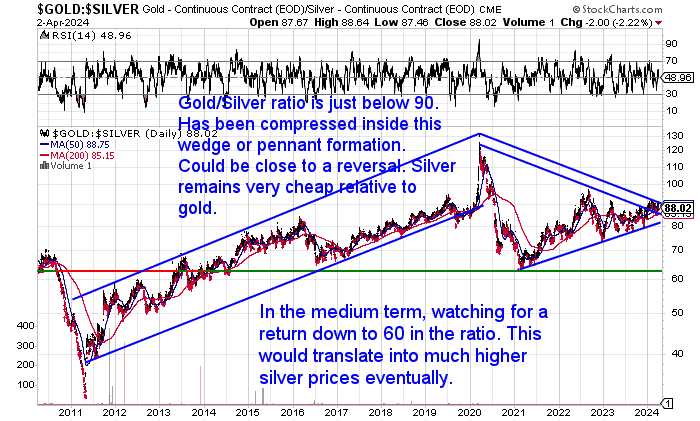
However like we said last week we think things may be looking up for silver.
Silver – About to Play Catch Up?
In NZ Dollar terms, just today, silver looks to have broken out of the multi-year consolidation pattern it has been in. With the price today getting clearly above the downtrend line in this wedge or pennant formation. A clear break about the horizontal resistance line around $45 will confirm the next leg up in silver has finally begun.
While USD silver (bottom of below chart) is also right on the verge of this occurring.
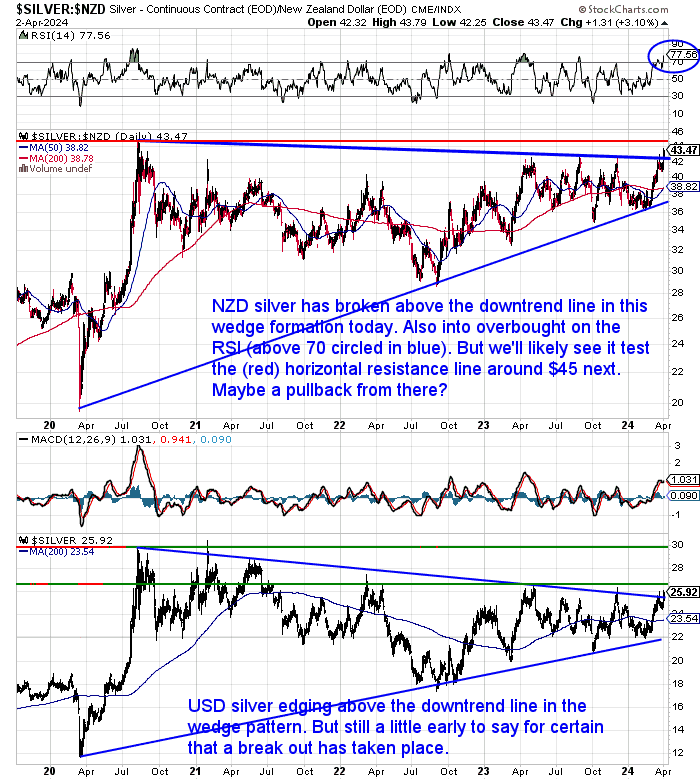
Once the 2020 high is beaten, where is silver likely to go from there?
Let’s zoom out on a longer term chart…
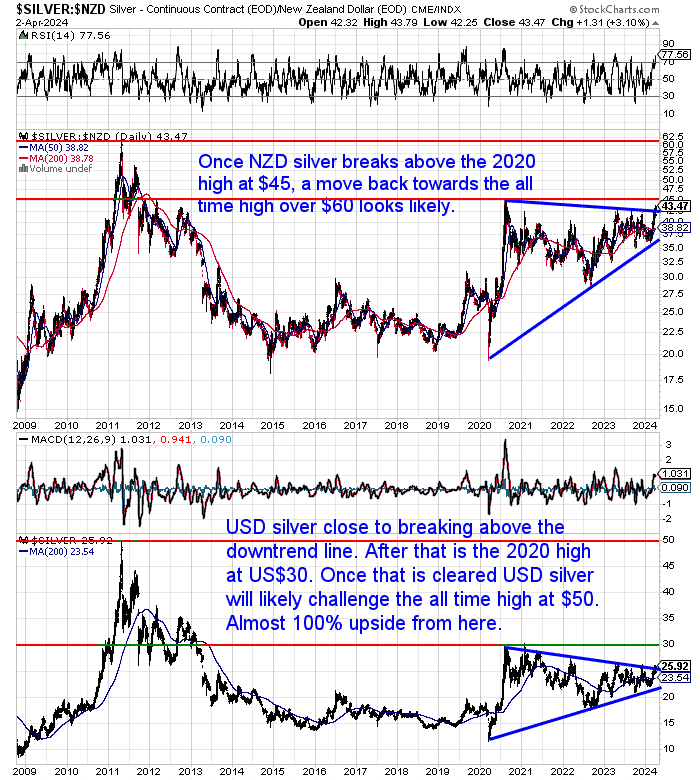
It’s an almost 100% upside to get back to the USD silver all time high from 2011.
That’s why…
- even though gold has broken out…
- even though gold is (starting) to make the news…
- even though most people will buy gold…
We think the best move you can make today is to BUY SILVER.
Sure, there may be another pullback before the 2020 high is broken. But this is likely to only be a smaller dip. The downside is just a few dollars, while the upside is many multiples more than that.
EDITOR’S NOTE: This article was first published 26 June 2019. Fully updated 3 April 2024 after a new USD gold price breakout.

Pingback: The Gold Correction is Underway - Gold Survival Guide
Pingback: How to Swap Gold for Silver - Taking Advantage of the Record High Gold Silver Ratio - Gold Survival Guide
Pingback: Should I Buy Gold Today or Wait?
Pingback: Has the Silver Breakout Started? Why a Short Squeeze Could be Developing - Gold Survival Guide
Pingback: Silver is the Star this Week - Gold Survival Guide