Silver is surging in 2025, already up 10% in USD and 8% in NZD—but is this just the beginning?
Could silver still be undervalued, or is it on the brink of a historic breakout?
In this article, we explore silver price predictions for 2025, using historical trends, expert projections, and key valuation models to answer the big question:
💡 How high could silver go next?
Table of contents
- How Silver Follows Gold: Key Price Projections
- How the Gold-to-Silver Ratio Predicts Silver’s Future Price
- What’s Silver’s Real High? Inflation-Adjusted Price Explained
- Can Silver Outperform Stocks? Dow-to-Silver Ratio Analysis
- How Money Supply Impacts Silver Prices
- Silver Price Predictions in NZD: What to Expect
- Final Silver Price Forecast Summary
Estimated reading time: 6 minutes
How Silver Follows Gold: Key Price Projections
Historically, silver lags behind gold in bull markets, but it often outperforms gold at the peak. Understanding gold’s potential trajectory can help predict silver’s next big move.
| Valuation Method | Estimated Gold Price (USD/oz) | Key Insight |
|---|---|---|
| Federal Reserve Balance Sheet Analysis | $26,051 | If USD were fully backed by gold today |
| Gold Backing to Debt Ratio (Historical Reset Model) | $35,800 | Compares gold to US government debt levels |
| Jim Rickards’ 40% Gold Backing Estimate | $10,000 – $11,500 | Based on historical gold backing of the USD |
| Mike Maloney’s Gold-to-Money Supply Model | $14,000 – $18,000+ | Adjusts for all USD base and credit currency |
| Inflation-Adjusted 1980 Gold High (Official CPI) | $3,421 | Adjusted to 2025 dollars using official inflation metrics |
Read More: How Do You Value Gold? What Price Could Gold Reach? 2025 Predictions
📌 Why This Matters: If gold reaches $25,000/oz, silver is likely to follow—potentially skyrocketing way past its previous all-time highs.
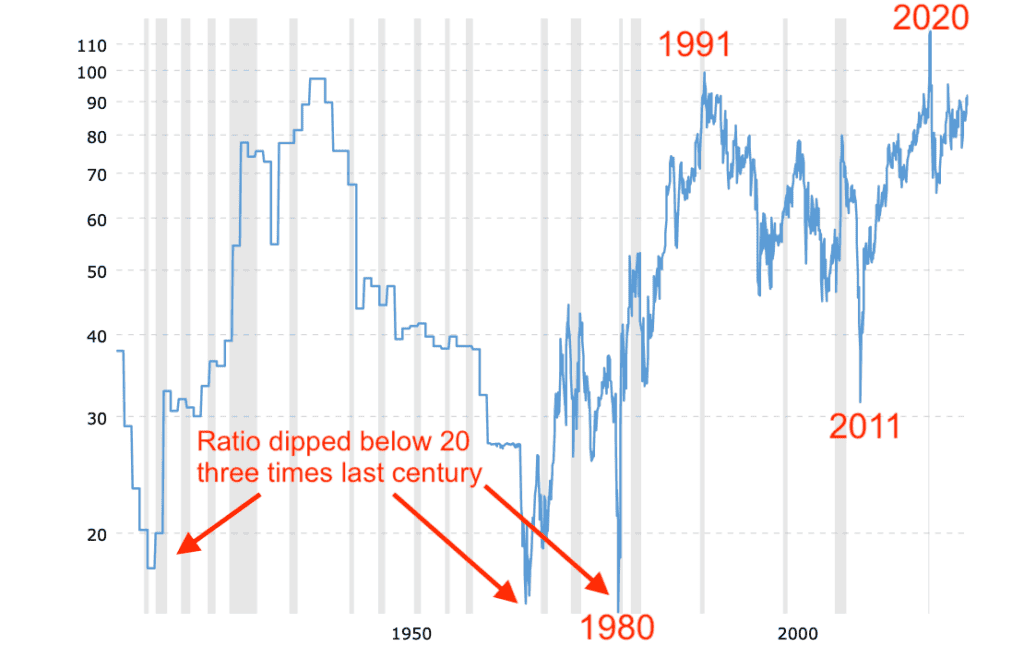
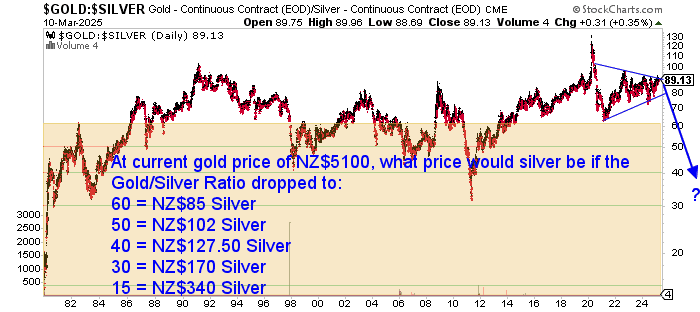
How the Gold-to-Silver Ratio Predicts Silver’s Future Price
The gold-to-silver ratio measures how many ounces of silver it takes to buy one ounce of gold. A lower ratio often signals a strong bull market in silver.
- Current Ratio: Approximately 90:1.
- Historical Averages: Typically between 50:1 and 70:1.
- Historical Low: 12:1.
Gold-to-Silver Ratio Silver Price Projections
Using the above gold price projections, combined with historical shifts in the gold-to-silver ratio, we can estimate a range of potential silver prices at different ratio levels:
| Gold Price (USD/oz) | 100:1 Ratio | 80:1 Ratio | 50:1 Ratio | 40:1 Ratio | 20:1 Ratio | 12:1 Ratio (Historic Low) |
|---|---|---|---|---|---|---|
| $2,900 | $29 | $36 | $58 | $73 | $145 | $242 |
| $5,000 | $50 | $63 | $100 | $125 | $250 | $417 |
| $10,000 | $100 | $125 | $200 | $250 | $500 | $833 |
| $15,000 | $150 | $188 | $300 | $375 | $750 | $1,250 |
| $20,000 | $200 | $250 | $400 | $500 | $1,000 | $1,667 |
| $25,000 | $250 | $313 | $500 | $625 | $1,250 | $2,083 |
| $30,000 | $300 | $375 | $600 | $750 | $1,500 | $2,500 |
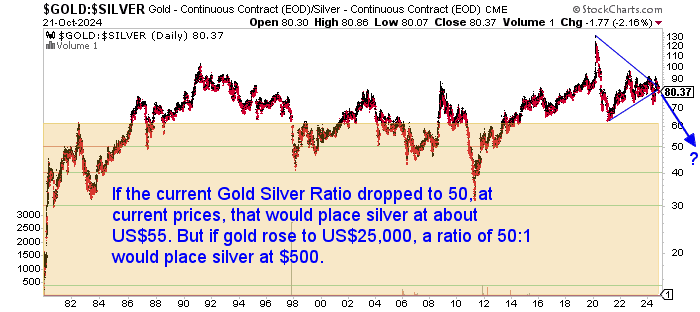
📌 Key Takeaway: If gold surges past $25,000/oz, silver could skyrocket to $500, or even past $2,000 if the ratio drops to historical lows.
Read more: What is the Gold Silver Ratio? What are New Highs in the Ratio Telling Us?
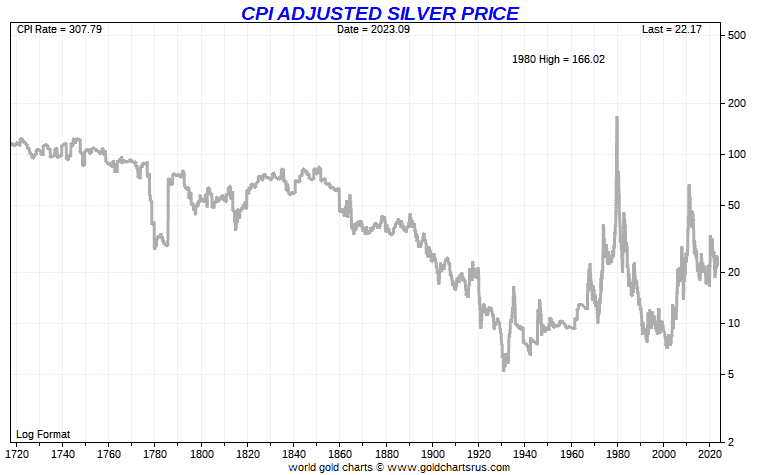
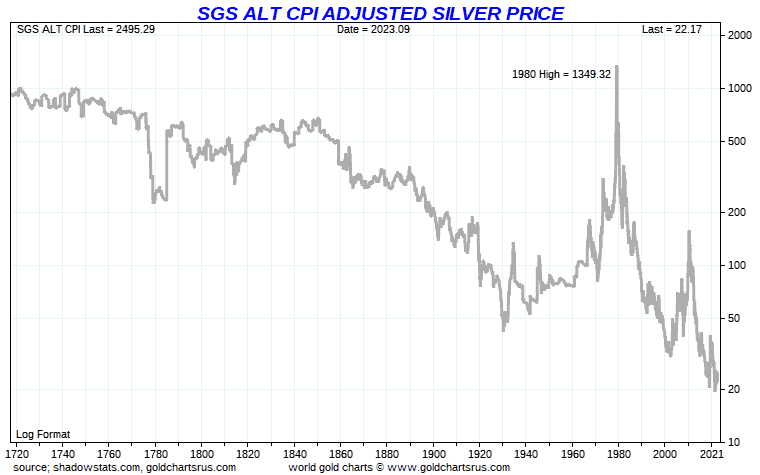
What’s Silver’s Real High? Inflation-Adjusted Price Explained
Adjusting for inflation gives us another angle on silver’s potential future value.
💡 Silver is one of the few financial assets that still hasn’t broken its nominal 1980 high of $50/oz.
| Silver Price Basis | Projected Silver Price (USD/oz) |
|---|---|
| 1980 High (Official CPI Adjusted) | $170 |
| ShadowStats 1980 High (Alternative Inflation Data) | $1,350 |
📌 Key Takeaway: Silver’s true inflation-adjusted peak may be far higher than most investors expect.
Can Silver Outperform Stocks? Dow-to-Silver Ratio Analysis
The Dow-to-Silver ratio compares silver’s value to the stock market.
- Historical Lows: In past silver bull markets, the ratio fell to as low as 17:1.
- If the Dow stays at 42,000 points and the ratio returns to 17:1, silver could hit $2,100/oz.
📌 Key Takeaway: If silver follows historical cycles, it could significantly outperform stocks in the next major bull run.

How Money Supply Impacts Silver Prices
💵 Silver’s price is directly tied to global money supply expansion.
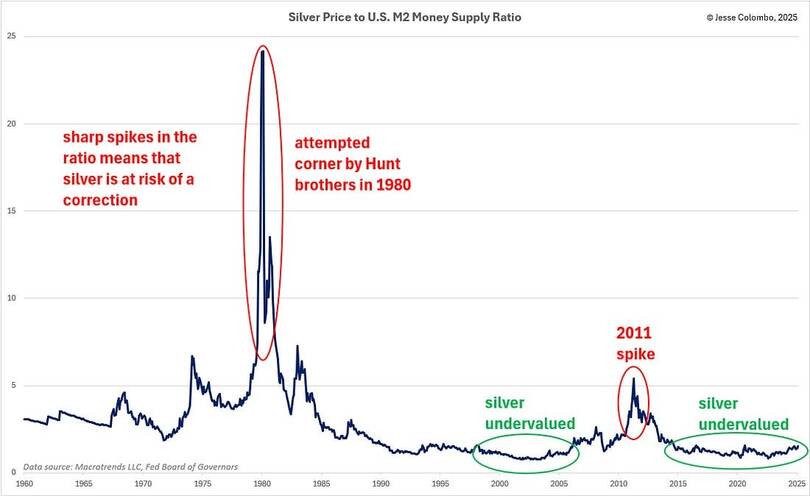
- Silver remains undervalued on a money supply basis.
- The silver price to US M2 money supply ratio shows silver could rise by:
- 5 times to match the 2011 peak
- Over 20 times to match the 1980 peak
| Silver Price Basis | Projected Silver Price (USD/oz) |
|---|---|
| Money Supply Ratio to 2011 Peak | $165 |
| Money Supply Ratio to 1980 Peak | $660 |
📌 Key Takeaway: Silver remains deeply undervalued compared to historical money supply growth.
Silver Price Predictions in NZD: What to Expect
All the above projections are in US dollars.
So at a 0.57 NZD/USD exchange rate, silver could reach:
| Projected Silver Price (USD/oz) | Equivalent NZD Price | Key Insight |
|---|---|---|
| $170 | $298 | Inflation-Adjusted 1980 High (Official CPI) |
| $500 | $877 | Gold-to-Silver Ratio 50:1 Projection at US$25,000 Gold |
| $1,350 | $2,368 | SGS Inflation-Adjusted Price (1980 CPI Methodology) |
| $2,100 | $3,684 | Dow-to-Silver Ratio Projection (17:1) |
| $2,083 | $3,654 | Gold-to-Silver 12:1 Ratio Projection |
📌 Key Takeaway: Even conservative projections show silver could be 5x higher in NZD terms.
Final Silver Price Forecast Summary
So here are the projected silver prices using the various methodologies above:
| Valuation Method | Projected Silver Price (USD/oz) | Key Insight |
|---|---|---|
| Gold-to-Silver Ratio (50:1) | $500 | If gold reaches $25,000 |
| Gold-to-Silver Ratio (12:1, historic low) | $2,083 | If gold reaches $25,000 |
| Inflation-Adjusted 1980 High (Official CPI) | $170 | Silver’s 1980 high adjusted using current CPI |
| ShadowStats Inflation-Adjusted High | $1,350 | Using 1980-era inflation methodology |
| Dow-to-Silver Ratio (Historical Low of 17:1) | $2,100 | If Dow stays at 42,000 |
| Money Supply Adjusted Projection | $165 – $660 | Based on past monetary expansion trends |
They vary from US$170 all the way up to US$2100. A good argument could be made that some of the above silver price predictions for how high silver could rise are pretty out there.
But inarguably, silver is still one of the most undervalued assets compared to gold, stocks, and money supply trends.
Final Thought:
- Silver is still deeply undervalued based on multiple valuation models.
- If gold rallies, silver could follow—and even outperform.
- The data suggests now may be a prime time to invest before prices surge higher.
📢 What’s your silver price prediction? Drop your thoughts in the comments below!
👉 Looking to invest? Browse our latest silver bullion offerings here.
Editors Note: This post was originally published 27 May 2020. Updated 12 March 2025 to include all new projections.
Pingback: Clarification on Negative Interest Rates - Gold Survival Guide
Pingback: Why RBNZ Q.E. Will Increase the Gap Between the Haves and Have Nots - Gold Survival Guide
Pingback: RBNZ QE Ahead of Plan - Chart Proves There’s More to Come - Gold Survival Guide
Pingback: Could Silver Be Worth More Than Gold? - Gold Survival Guide
Pingback: Will Silver Repeat Mid 70’s and Mid 00’s Break Out? - Gold Survival Guide
Isn’t a gold price of $25000 a bit of a stretch even in these crazy times?
Yes at first glance that does sound pretty extreme Bruce. However rather than only considering that the price sounds very high (which we agree it does), if instead we compare gold to other assets on an historical basis, it doesn’t look quite so outlandish. For example if the housing to gold ratio returns to historical lows and house prices went up a bit we would see gold at around $20,000. Also for a 100% gold backing of the US central bank assets gold would need to rise to $26,051. Back in 1980 the gold price at $850 meant the US dollar was fully backed by gold and the US could have returned to a gold back currency then – but they didn’t. Recent numbers from Incrementum AG also gives similar numbers in excess of US$22,000 for the money supply to be fully backed by gold. Inflation adjusted numbers are not so high using current inflation methodology; gold’s 1980 high of $850/oz is worth $3,421 in 2025 dollars. But using 1980-era CPI formula, Shadow Government Statistics instead arrives at $28,641. Of course all these numbers are based upon gold returning to be more central to the global monetary system, which is by no means guaranteed. However something has to happen to balance out all the debt and currency that has been created. So the odds still seem pretty decent that gold will be significantly higher than current prices when all is said and done.