Wondering whether now is the time to hold more gold than stocks? The Dow to Gold Ratio can help you decide. This long-term signal tracks the cycles of gold versus shares — and it might be flashing an important warning in 2025.
Table of contents
Estimated reading time: 6 minutes
What is the Dow Gold Ratio — and Why Does It Matter?
The Dow Gold Ratio is a simple but powerful metric.
It tells you how many ounces of gold it takes to “buy” the Dow Jones Industrial Average.
- Formula: Dow Jones Index ÷ Gold Price (USD)
- Example: If the Dow is at 47,000 and gold is $4,000, the ratio is 11.75
This ratio helps investors compare the relative value of shares vs gold — across decades and even centuries. It highlights when stocks are likely overvalued and when gold may be undervalued — and vice versa.
Think of it as a wealth cycle indicator rather than a short-term trading tool.
Dow Gold Ratio: A Century of Wealth Cycles
For more than 100 years, the Dow Gold Ratio has swung in long cycles:
| Year | Stocks High or Gold High? | Ratio |
|---|---|---|
| 1929 | Stocks Peak (Before Crash) | ~18 |
| 1932 | Gold Peak / Stocks Crash | ~2 |
| 1980 | Gold Peak (Crisis + Inflation) | <1 |
| 1999 | Dotcom Bubble – Stocks Peak | >40 |
| 2011 | Gold Peak (Post-GFC) | ~6 |
| 2025 | Stocks High, But Gold Rising Fast | 11.50 |
These cycles suggest we’re in a long-term phase where gold is regaining ground on shares.
Dow Gold Ratio in 2025: Latest Numbers
| Date | Dow Index | Gold Price (USD) | Dow/Gold Ratio |
|---|---|---|---|
| Nov 2021 | 35,914 | $1,791 | 20.05 |
| Apr 2023 | 33,601 | $1,983 | 16.94 |
| Aug 2024 | 39,357 | $2,473 | 15.91 |
| Nov 2025 | 47,369 | $4,119 | 11.50 |
Despite the Dow reaching a new nominal high, gold has climbed even faster. This drop in the ratio signals gold is outperforming shares — quietly but steadily.
What Does This Mean for Investors?
The falling Dow Gold Ratio suggests one of two things:
- Stocks are losing value in real terms, or
- Gold is gaining relative strength
Historically, these moments come during times of:
- Economic instability
- Currency debasement
- Rising government debt
- Global uncertainty
In those times, gold acts as a safe haven — and the Dow Gold Ratio becomes a warning bell for overvalued paper assets.
Long-Term Charts: The Big Picture
For live and interactive charts, platforms like TradingView can be useful. But long-term historical views like the one below help reveal the bigger picture.
Here’s a look at the history of the Dow to Gold Ratio going back more than a century: A 120-year view of the Dow Gold Ratio with trendlines and prediction bands:
Dow Gold Ratio Chart: 120-Year View
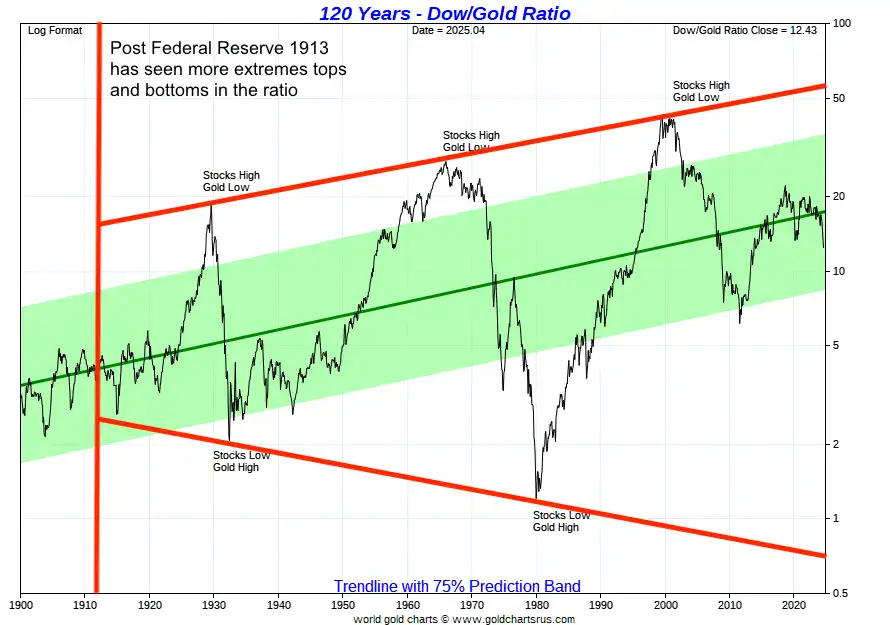
Notice how the ratio cycles from extremes above 20 (stocks expensive) to lows below 1 (gold expensive). We’re currently mid-cycle — and possibly heading toward a new low.
Long-Term Target: Dow/Gold at 1:1?
Some analysts believe the ratio could return to 1:1 — just as it did in:
- 1932 (Great Depression)
- 1980 (Stagflation & oil shocks)
Here’s a closer look at recent ratio trends since 2008:
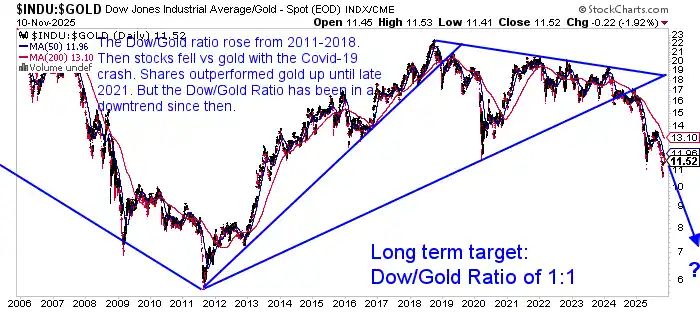
“The Dow/Gold ratio rose from 2011–2018. Then stocks fell vs gold with the Covid-19 crash. Shares outperformed gold up until late 2021. But the Dow/Gold Ratio has been in a downtrend since then.”
Source: StockCharts Annotations: Gold Survival Guide – Nov 2025
We believe the macro environment could push the ratio toward 5… or even 1 over the coming years.
Read more: The Gold Standard and a Free Market For Money
How to Use the Dow Gold Ratio in Your Portfolio
Rather than a short-term signal, the ratio helps you gauge when shares might be overvalued — and when gold could be the better bet.
Use it to:
- Gauge when stocks may be overvalued
- Decide when to increase gold holdings
- Understand broader economic cycle shifts
Here’s a simplified rule of thumb:
| Ratio Range | Implication | Action |
|---|---|---|
| Above 20 | Stocks likely expensive | Consider buying more gold |
| 5–20 | Transition zone | Balanced allocation |
| Below 5 | Gold likely expensive | Consider rotating back into shares |
| ~1 | Cycle bottom | Major monetary shifts often occur |
FAQs on the Dow Gold Ratio
As of November 2025, it’s 11.50 — down from 20.05 in 2021.
The chart shows how many ounces of gold it takes to buy the Dow Jones Index. Over time, it swings in long cycles — with high ratios when stocks are expensive, and low ratios when gold outperforms.
Over the long run, gold and the S&P 500 often move in opposite directions, especially during times of crisis or inflation. This lack of correlation is what makes gold a valuable hedge in a diversified portfolio.
Historically, yes. Falling ratios usually signal rising gold strength or weakening equities.
Not necessarily. But if the ratio is falling and risks are rising, it may be time to increase your gold allocation.
It has twice before in the last century. With debt, inflation, and systemic risks building, another move toward 1:1 is possible.
Final Thoughts: What This Ratio Might Be Warning About
The Dow Gold Ratio is quietly flashing a yellow light for share investors. While stocks have hit new highs, gold is gaining momentum in the background.
With inflationary pressures, global debt, and monetary uncertainty mounting, gold may be setting up for another era of outperformance.
This doesn’t mean sell everything. But it might mean it’s time to:
- Reduce paper asset exposure
- Accumulate physical gold
- Prepare for systemic shifts
If the ratio keeps falling, you’ll be glad you acted early.
Further Reading & Tools
- Gold vs Stocks, Bonds & Cash: 25-Year Showdown
See actual returns and performance charts from 2000–2025.
Got Questions?
Have questions about your own portfolio?
Not sure how much gold is enough?
Want to understand the best way to buy and store bullion in NZ?
Free Updates
Want updates on the Dow Gold Ratio, gold price alerts, and market insights?
We’ll send you weekly updates, charts, and insights you won’t find anywhere else.
Editors Note: This post was originally published 27 June 2017. Last Updated 11 November 2024.
Pingback: Gold and Silver Technical Analysis: The Ultimate Beginners Guide - Gold Survival Guide
Pingback: How Do You Value Gold - What Price Could it Reach?
Pingback: Gold Ratios Update: Dow/Gold, NZ Housing to Gold, & Gold/Silver Ratio - Gold Survival Guide
Pingback: Gold Cycles vs Property Cycles: When Will Gold Reach Peak Valuation? - Gold Survival Guide
Pingback: Good Time to Sell NZ Shares and Buy Gold or Silver?
Pingback: Gold Mining Shares vs Physical Gold Bullion - Gold Survival Guide
Pingback: Why Buffett is (Still) Wrong About Gold - But How He Loves Silver - Gold Survival Guide
Pingback: When Will You Know It's Time to Sell Gold?
Pingback: NZD Gold Makes New All Time High - Rising With Hardly a Pause - What to Do? - Gold Survival Guide
Pingback: Update on Bullion in New Zealand Post Lock Down - Gold Survival Guide
Pingback: Extreme Monetary Policy Now the New Normal in New Zealand Too? - Gold Survival Guide
Pingback: Is it Too Late to Buy Gold? [Video] - Gold Survival Guide
Pingback: Greed Index is Approaching Extremes - Gold Survival Guide
Pingback: If New Zealand Introduces a Central Bank Digital Currency, How Will Gold or Silver Be Valued and How Will One Use Them? - Gold Survival Guide
Pingback: Why Buy Gold? Here's 15 Reasons to Buy Gold Now
Pingback: Gold vs Stocks: Historical Returns - Gold Survival Guide
Pingback: What Percentage of Gold and Silver Should Be in My Portfolio? [2023 Update] - Gold Survival Guide
Pingback: The (Not So) Slow Death of the Dollar - 9 Recent Indicators of the Dollars Demise - Gold Survival Guide
Pingback: New Zealand Share Market Hits 16 month Low - Gold Survival Guide
A fascinating comparison between gold and shares over the very long time. But surely gold has an advantage. When I purchased the gold in 1800 (I have a very long memory); I just put the coins under the mattress. The shares however had to be bought and sold to maintain a presence on the ever changing composition of the index. That would incur brokerage fees and fund management fees these days. As for taxes these would vary depending on location regarding the share trading activity..
In the case of gold as a Canadian citizen owning Maple Leaf coins I would pay no taxes if they were sold as the coins are legal tender there. In other words gold is the ideal lazy mans long term investment.
Yes good point you make Maurice that gold just needs to “sit there and do nothing” compared to other investments and as you say if you just hide it there are no storage costs. Thanks for sharing.