The best predictor of a recession we have seen is the yield curve. While the yield curve may sound like something only economists would know about and discuss, it’s actually a surprisingly simple measure. In this post we’ll cover:
Table of Contents
- What is the Yield Curve?
- What is an Inverted Yield Curve?
- What Does an Inverted Yield Curve Mean?
- How Does the Yield Curve Predict Recessions?
- When Did the Yield Curve Last Invert?
- What is the Yield Curve Saying Today?
- Recession Indicator: How Far Away Might the Next Recession Be?
- The Yield Curve is Being Manipulated – So a Recession May Be Closer Than We Think
- But Things Are Different This Time, Aren’t They?
- What to Do to Prepare?
- The Yield Curve and Gold and Silver Investing
What is the Yield Curve?
The yield curve is simply a plot of the interest rates (or yields) of bonds with different maturation dates. A maturation date is the date the bonds expire and the principle is returned to the bond investor.
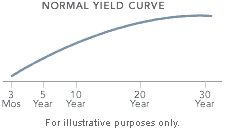
The yield curve is usually positive. Meaning the longer dated bonds have a higher interest rate than the shorter dated bonds.
Why is that?
Well if you lend someone money for a month versus someone else for 10 years, who would you want a higher rate of interest off? The 10 year loan of course, as there is a much higher risk in lending for the longer period.
Given you don’t know how market conditions – and therefore interest rates – might vary over such a long time.
Likewise bond investors expect a lower return when their money is tied up for a shorter period. Whereas they will want a higher yield to give them more return on a long-term investment.
This positive yield curve is important for banks and their profits. Banks “borrow short” and “lend long”. That is, banks take deposits off savers and pay them a lower interest rate and then issue mortgages for longer periods at higher rates. So banks rake in the profits with a wide positive spread. Which is exactly what they have been doing in recent years.
What is an Inverted Yield Curve?
Whereas an inverted yield curve occurs when the yields on short term bonds are higher than the yields on longer term bonds. This generally only happens with the likes of US Treasury note yields. That’s when yields on one-month, six-month or one-year Treasury bills are higher than yields on 10-year or 30-year Treasury bonds.
What Does an Inverted Yield Curve Mean?
Here is a really good explanation:
An inverted yield curve means that investors have little confidence in the economy. They would prefer to buy a 10-year Treasury note and tie up their money for ten years even though they receive a lower yield. That makes no logical sense. Investors typically expect a higher return on a long-term investment.
An inverted yield curve means investors believe they will make more by holding onto the longer-term bond than if they bought a short-term Treasury bill. That’s because they’d just have to turn around and reinvest that money in another bill. If they believe a recession is coming, they expect the value of the short-term bills to plummet sometime in the next year. That’s because the Federal Reserve usually lowers the fed funds rate when economic growth slows. Short-term Treasury bill yields track the fed funds rate.
So why does the yield curve invert? As investors flock to long-term Treasury bonds, the yield on those bonds lower. That’s because they are in demand, so they don’t need as high a yield to attract investors. The demand for short-term Treasury bills falls, so they need to pay a higher yield to attract investors. Eventually, the yield on short-term bills rises higher than the yield on long-term bonds, and the yield curve inverts.
During normal growth, the yield on a 30-year bond will be three points higher than a three-month bill. However, if investors believe that the economy will be slowing over the next couple of years, and then speeding up again in 10-20 years, they would prefer to tie up their money until then, rather than have to reinvest it sooner at much lower rates.
Source.
An inverted yield curve is not great for the banks. So credit becomes tighter as they are more reluctant to lend.
How Does the Yield Curve Predict Recessions?
When an economy is booming, the central bank usually raises interest rates, with a view to slowing inflation and business activity. As a result the yield curve goes negative.
The opposite occurs when an economy has been in recession, or is coming out of a recession. Short term interest rates have been lowered, with the aim of increasing business activity.
So changes in the yield curve can give an indication of economic conditions. The easiest way to track these changes is by plotting the spread between a short term and long term yield over time.
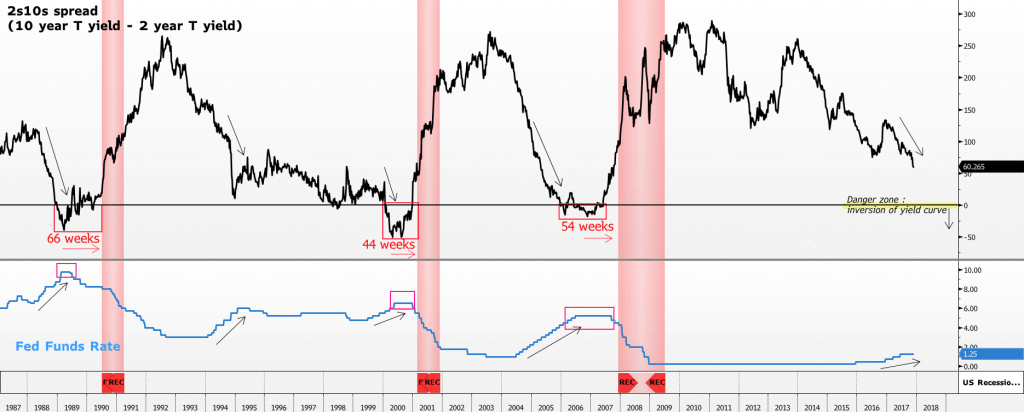
The chart below shows what is called the “2s10s spread”. This shows the difference between the 10-year US government treasury yield and the 2-year treasury yield. It is an easy way to track changes in the yield curve. When the 2s10s spread falls below 0, this provides a good indication of an impending recession. This chart is actually from back at the end of 2017.
“Historically, when the 2s10s spread falls into the negative territory, a recession tends to follow within a few months. At the same time when the 2s10s spread is below 0, the yield curve would invert.”
When Did the Yield Curve Last Invert?
You can see in the chart above that the spread was declining leading into the end of 2017. This was due to the Fed funds rate (the US central bank interest rate) increases over the previous few years (see the bottom section of the chart for this). Thereby pushing up short term interest rates.
Now below is a live chart from the US Federal Reserve plotting the 2 year to 10 year Treasury bond spread.
If you zoom in you may be able to see that on the 27 August 2019, the spread dropped to -0.4. That is the closing price. During the day it actually went negative and that garnered a lot of headlines.
The spread of -0.4 is the lowest since February 2007.
So the 2 and 10 year spread went conclusively below zero in August 2019. This resulted in an inverted yield curve. A recession (indicated by the grey bar) resulted about 6 months later. Some would argue this was caused by covid19. But it seems more likely the lockdowns simply sped up the inevitable.
What is the Yield Curve Saying Today?
So enough history! What is the yield curve saying today?
Looking once again at the live chart above, we can see the 2s10s spread again went negative on 1 April 2022 – an April fools day prank perhaps? It would be nice if it was.
But if history is any guide, this is again indicating a recession may be on the way for the USA. And where the USA goes the rest of the world usually follows.
Recession Indicator: How Far Away Might the Next Recession Be?
The 5 previous occasions the 2s10s spread went below zero, a recession followed soon after (red zones in the chart above or see grey areas in the live chart below).
On average a recession has followed 54 weeks after the yield curve inverted. But the time delay has varied greatly.
The Yield Curve is Being Manipulated – So a Recession May Be Closer Than We Think
Mike Maloney explained back in 2018 in this very good video below, that the short end of the yield curve – the 3 month bill rate – was being manipulated by the Fed. The same thing is still happening today. This interest rate would likely be much higher today if the Fed wasn’t buying these bills to keep the rate low. So we would actually have a more inverted curve already if it weren’t for this. Therefore, just like back in 2019, a recession may be closer than we think.
But Things Are Different This Time, Aren’t They?
Recently we have seen more and more mainstream media outlets also discussing the yield curve. Although some are arguing that this time may be different:
Not all are convinced on the downbeat view of things
But things are different this time, experts also say – and boy they are. Given the US Fed’s mammoth QE programs over the last 2 years, the US treasury market is now in uncharted territory.
“[The Fed’s QE program] has resulted in an undervalued U.S. 10-year yield that will rise when the central bank starts shrinking its balance sheet, steepening the curve,” Reuters wrote, summarising analyst sentiment.
Source.
But here’s where we wonder, will the Fed actually shrink its balance sheet in a meaningful way?
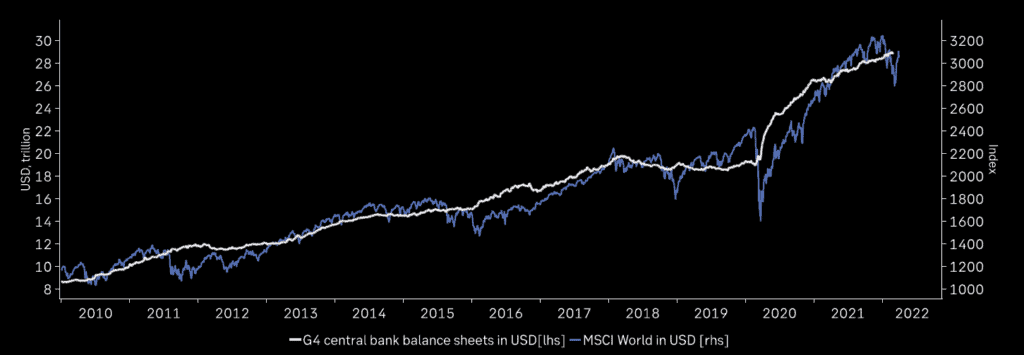
The US Federal Reserve balance sheet growth has slowed recently. But in the first 3 months of 2022 it has still expanded by over 2%.
The Market Ear shared a chart of the G4 central bank balance sheets. Clearly the 4 largest economies are not really tightening yet…
Is monetary policy tight? It depends on how you look at it
Central bank balance sheets are still expanding: this is definitely not hawkish
Source.
What to Do to Prepare?
History shows us that the inversion of the yield curve is a reliable recession indicator. Right now it shows a recession is getting closer for the USA. New Zealand and the rest of the world will not escape unscathed. So now would normally be a good time to start building a cash position. However with inflation rates high and likely staying that way or getting worse, cash might not be the best thing to hold right now.
If your investments are mainly in the sharemarket or property it might also be a good time to consider diversifying into alternative assets such as gold and silver bullion too.
Particularly as these look to be at the start of the next cycle higher. Read more: Gold Cycles vs Property Cycles: When Will Gold Reach Peak Valuation?
The Yield Curve and Gold and Silver Investing
So is the yield curve any help in determining when to buy gold or silver?
Sort of.
When the yield curve becomes inverted (i.e. 2s10s spreads drop below zero), and a recession is often about to happen, this can prompt people to prepare for an economic slowdown.
“Entrepreneurs start fighting for increasingly limited resources so they can fully fund their projects. Creditors will start to accept yields that are smaller. The upshot of all this is that gold and silver prices are likely to rise. People will be looking to invest in gold and silver as part of their preparation for an impending economic downturn.”
Source.
However we’d also say that the correlation between the yield curve and gold is not strong. Gold can have many drivers affecting its price. But gold and silver look to be in the early stages of a bull market. Conversely the business cycle looks to be topping out. So with a recession likely around the corner, the coming changing of the yield curve may well be a bullish indicator for gold and silver too.
View the range of gold and silver available to purchase here.
Editors Note: Originally posted 20 March 2018. Updated 29 August 2018 added live 2 year to 10 year bond spread chart. Along with commentary on it and impending recession. Also updated 5 December 2018 and again on 3 April 2019 and 20 August 2019 to include latest 2 and 10 year spread numbers and further commentary. Last updated 8 April 2022 to include most recent negative dip in the 2s10s spread.
Read more: Interest Rates and Gold: If Interest Rates Rise What Happens to Gold?
Pingback: The Next Gold Bull Market Looms - Gold Survival Guide
Pingback: Everything is Awesome! But Will Gold Rise After the Latest Fed Rate Hike? - Gold Survival Guide
Pingback: Interest Rates and Gold: If Interest Rates Rise What Happens to Gold? - Gold Survival Guide
Pingback: Why Do Analysts Believe That This Is the Right Time ToSell Gold? – Indy Discovery Network
Pingback: Should I Buy Gold Today or Wait?
Pingback: Is a Big Move Brewing in Silver? - Gold Survival Guide
Pingback: Are We Just Seeing A Pause In Longer Trends? - Gold Survival Guide
Pingback: NZX50 Near Highs But This Indicator Says the NZ Economy is Slowing Sharply - Gold Survival Guide
Pingback: Rickards: The Lucky Country is Out of Luck - How About New Zealand? - Gold Survival Guide
Pingback: US Stock Market to Return Zero for Next 12 Years? - Gold Survival Guide