The gold/silver ratio [GSR] is a powerful signal many investors overlook. But in 2025, with the ratio climbing again after the announcement of new Trump tariffs, this simple measure is flashing a potential buy signal for silver.
In this guide, we’ll break down what the gold/silver ratio is, why it matters now, and how you can use it to make smarter precious metals decisions.
Table of contents
- What is the Gold Silver Ratio?
- Why the Ratio Is Spiking Again in 2025
- What a High Gold/Silver Ratio Means for You
- When Has the Ratio Spiked Before?
- How to Use the Gold/Silver Ratio in Your Strategy
- How High Could Silver Rise if the Gold/Silver Ratio Falls?
- Silver vs Gold in a Monetary Crisis
- Today’s Best Silver Deal (April 2025)
- Quick Recap
- Gold Silver Ratio FAQs:
- Final Thought: Build Sovereignty with Strategy
Estimated reading time: 8 minutes
What is the Gold Silver Ratio?
The gold/silver ratio tells you how many ounces of silver it takes to buy one ounce of gold.
- If the ratio is 80, it takes 80 ounces of silver to buy one ounce of gold.
- If the ratio is 50, silver is stronger compared to gold.
This ratio has been tracked for centuries. Historically, it hovered around 15 when silver was part of the monetary system. More recently, the long-term average sits around 45–50.
Historical Gold/Silver Ratios Over Time
Here’s how the gold/silver ratio has shifted through major economic eras:
| Period | Ratio | Notes |
|---|---|---|
| Roman Empire | 12:1 | Fixed by Roman monetary law |
| U.S. Coinage Act 1792 | 15:1 | Legal ratio set by U.S. Congress |
| Pre-WWI Average | 16:1 | Near-parity when silver was a monetary metal |
| 20th Century Average | 47:1 | Post-gold standard, ratio began to float |
| 2008 GFC Peak | 84:1 | Gold surged as a safe haven |
| 2020 COVID Crash | 125:1 | Record high amid global panic |
| 2025 | 100 (current) | Still unfolding… |
Historical data shows the GSR has returned to long-term averages time and again — often in dramatic fashion.
👉 Learn more about the gold/silver ratio’s history
📌 This long-term view shows how extreme today’s level is — and why silver may be poised to outperform.
The Gold/Silver Ratio Over the Last 125 Years
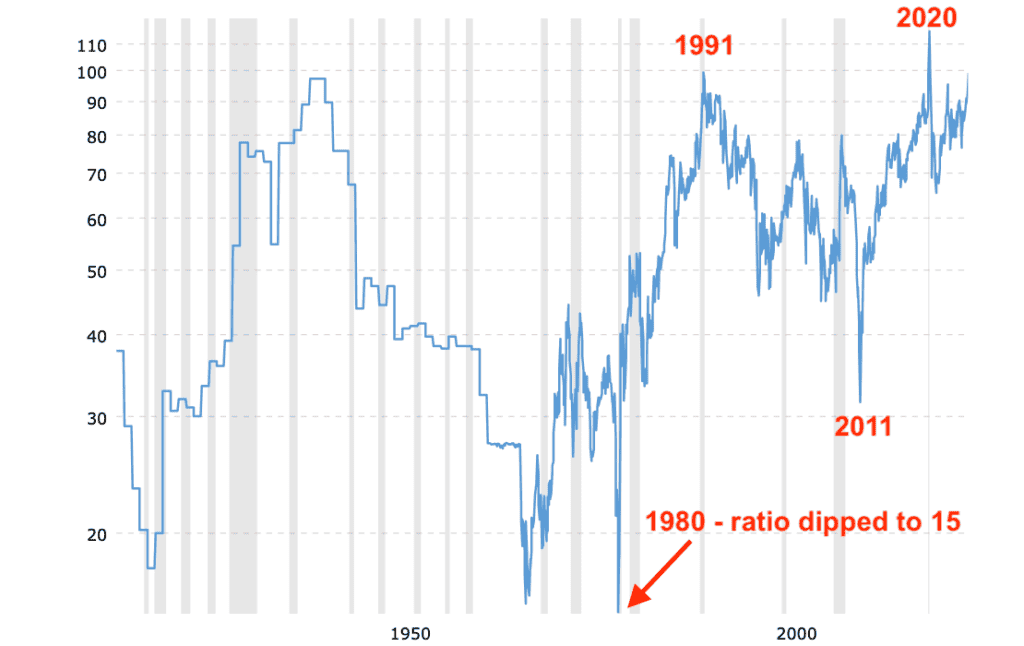
📌 This chart shows how the ratio has repeatedly reverted after major spikes — and during past bull markets, silver has dramatically outpaced gold. In 1980 the ratio dropped below 20. In 2011 it returned to 30. Could we be seeing the early stages of another major silver run?
As seen in the 125-year GSR ratio chart above, silver has a history of dramatic surges during precious metals bull markets.
In:
- 1980, the ratio dropped to under 20 — as silver spiked to nearly $50/oz
- 2011, it returned to 30, following the GFC and Fed stimulus
Each time, this followed a major ratio spike — just like what we’re seeing in 2025.
👉 Our view? We could be at the beginning of the next multi-year cycle — with silver once again positioned to gain ground on gold.
Why the Ratio Is Spiking Again in 2025
As of mid-April 2025, the ratio has jumped back above 100 — a level not seen since the COVID crash in 2020.
This sharp move followed the announcement of new Trump tariffs — read our full analysis here — which boosted safe-haven demand for gold, leaving silver behind.
What’s behind the move?
- ✅ Trump’s new tariffs: Markets reacted quickly to rising global trade tension
- ✅ Silver lagging: Gold surged faster as the preferred crisis hedge
- ✅ Industrial concerns: Fears of a potential U.S. recession have weakened sentiment for silver, which has significant industrial use — especially in electronics and solar. 👉 See global silver demand data here
📈 This widening gap could be setting up for another silver catch-up rally.
What a High Gold/Silver Ratio Means for You
A high ratio has historically been a signal to consider buying silver.
Here’s why:
- 🪙 Silver may be undervalued relative to gold
- 📉 Past peaks in the ratio have often led to strong silver rallies
- 🔁 The ratio tends to mean revert — returning to average levels over time
📊 Example:
In 2020, the ratio spiked to over 125 during the COVID panic. Within months, it dropped back to 65 — and silver doubled in price.
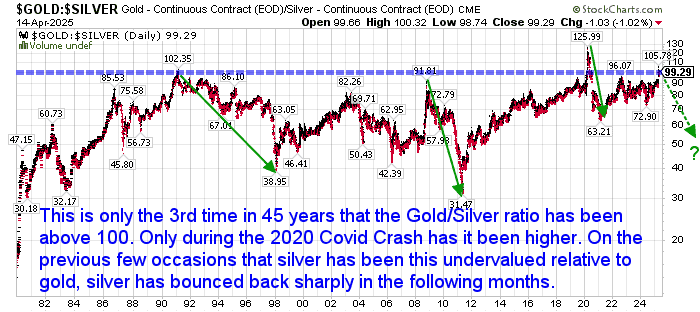
📌 This chart shows how silver has historically surged following major spikes in the GSR — highlighting why extreme levels are often prime entry points.
When Has the Ratio Spiked Before?
| Year | Ratio Peak | What Happened Next |
|---|---|---|
| 2008 | 84 | Silver rose 300% in 2 years |
| 2020 | 125 | Silver doubled in 6 months |
| 2023 | 91 | Silver rose 20% in 4 months |
| 2025 | 100 (current) | Still unfolding… |
Note: Past performance isn’t a guarantee — but these patterns offer insight.
How to Use the Gold/Silver Ratio in Your Strategy
Here are 3 ways to make the ratio work for you:
1. Buy Silver When the Ratio Is High
- History shows this may be when silver is cheapest relative to gold
- Current level of 100 is one of the most extreme in recent years
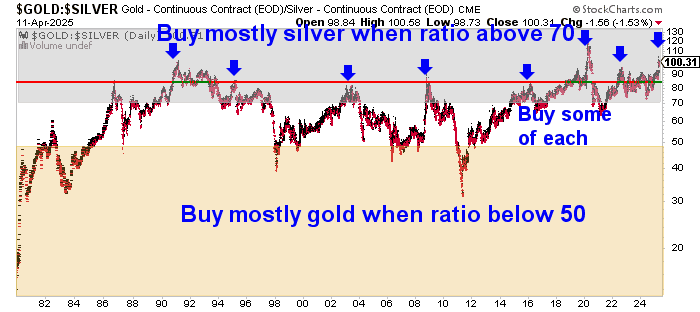
📌 Gold/Silver Ratio Buy Zones: Historically, buying silver during high ratio periods has yielded strong returns when the ratio reverts.
📚 Want more help timing your purchases?
Check out our full guide on When to Buy Gold or Silver.
2. Swap Gold for Silver Strategically
- Some investors swap gold for silver at high ratios and reverse the trade when the ratio drops
- For example, sell 1oz of gold to buy 100oz of silver. When the ratio falls to 50, swap back — and gain more gold
- Many long-term investors use this strategy to accumulate ounces over multiple market cycles.
👉 Learn how ratio trading works from Kitco
3. Use Dollar-Cost Averaging
- Spread your silver buying over time
- You reduce the risk of trying to “time the bottom” exactly
How High Could Silver Rise if the Gold/Silver Ratio Falls?
Want to see what silver could be worth if the GSR drops? Here’s a projection table showing silver prices at various gold price levels and ratios:
| Gold Price (USD/oz) | 100 | 90 | 80 | 70 | 60 | 50 | 40 | 30 | 20 | 10 |
|---|---|---|---|---|---|---|---|---|---|---|
| $3,000 | $30.00 | $33.33 | $37.50 | $42.86 | $50.00 | $60.00 | $75.00 | $100.00 | $150.00 | $300.00 |
| $3,500 | $35.00 | $38.89 | $43.75 | $50.00 | $58.33 | $70.00 | $87.50 | $116.67 | $175.00 | $350.00 |
| $4,000 | $40.00 | $44.44 | $50.00 | $57.14 | $66.67 | $80.00 | $100.00 | $133.33 | $200.00 | $400.00 |
| $4,500 | $45.00 | $50.00 | $56.25 | $64.29 | $75.00 | $90.00 | $112.50 | $150.00 | $225.00 | $450.00 |
| $5,000 | $50.00 | $55.56 | $62.50 | $71.43 | $83.33 | $100.00 | $125.00 | $166.67 | $250.00 | $500.00 |
| $10,000 | $100.00 | $111.11 | $125.00 | $142.86 | $166.67 | $200.00 | $250.00 | $333.33 | $500.00 | $1,000.00 |
📌 These projections help visualise potential silver prices if the ratio returns to more “normal” levels — assuming gold holds steady.
Silver vs Gold in a Monetary Crisis
As we explain in the Gold Survival Guide eCourse, both silver and gold are real money — unlike fiat currencies that lose value over time.
But in a crisis:
- 🪙 Gold is better for storing large amounts of wealth
- ⚖️ Silver is often more practical for small transactions and spending
Smart investors hold both, adjusting based on market signals — like the gold/silver ratio.
Today’s Best Silver Deal (April 2025)
🔥 Subscriber-Only Special: 1kg Silver Bars – 8% Above Spot
Dealers Choice – Various Mints – 999 Fine Silver
- 💸 Priced at $37 per bar less than local retail for 1kg bars
- 🧊 Mint selection is at our discretion — but every bar is fully verified
- 🔐 Not available on our website — exclusive to our email subscribers
- ⚠️ Limited quantity available — once they’re gone, they’re gone
📩 Want in?
Sign up for our free daily price alerts
or contact us directly to secure your bars.
Quick Recap
- The gold/silver ratio is back above 100, far beyond the historical average
- Silver looks undervalued — and may be setting up for a major rally
- Consider buying silver, especially if you already hold gold
- History suggests silver could outperform dramatically as the ratio reverts
Gold Silver Ratio FAQs:
Still have questions about the ratio? Here are some of the most common ones we hear:
A: The gold silver ratio is the number of ounces of silver it takes to buy one ounce of gold. It is calculated by dividing the gold price by the silver price. For example, if the gold price is US$3000 and the silver price is US$30, the gold silver ratio is 100.
A: Historically, any time the ratio is over 80 has been a good time to consider going more heavily with silver.
A: The gold silver ratio can be used as a trading strategy to take advantage of the price fluctuations of gold and silver. The basic idea is to buy silver when the ratio is high, and sell silver and buy gold when the ratio is low. For example, if the ratio is 90, you could buy 90 ounces of silver with one ounce of gold. If the ratio drops to 45, you could sell your 90 ounces of silver and buy two ounces of gold. This way, you would increase your gold holdings by one ounce without spending any money.
A: It can fluctuate daily with market prices — keep an eye on our live charts.
A: Possibly. If you have a long-term view and believe silver is undervalued, this can be a smart play.
A: Not necessarily. They serve different purposes. Silver tends to be more volatile and can outperform in certain windows.
Final Thought: Build Sovereignty with Strategy
At Gold Survival Guide, we believe true wealth isn’t just measured in dollars — it’s measured in freedom, knowledge, and peace of mind.
The gold/silver ratio is more than a chart — it’s a powerful signal that helps you cut through market noise and make smarter, more sovereign decisions. Right now, that signal is flashing opportunity.
Whether you’re new to silver or ready to rebalance, there’s no better time to act than when the herd is looking the other way.
👉 Sign up for our free daily price alerts
👉 Or explore our latest silver deals now.
What do you think? Show us you’re alive and leave a comment below!
Editors Note: This article was originally published 18 September 2018. Fully updated 15 April 2025.

Glenn's dedication to educating individuals on wealth protection through precious metals has helped over 2400 clients from New Zealand, Australia, USA and Europe to safeguard their financial futures. Passionate about financial independence and lifestyle freedom, Glenn’s mission is to empower others with the knowledge and tools to thrive in today’s volatile economic environment. When he's not advising on precious metals, Glenn enjoys spending time with his family and pursuing outdoor adventures.
Education: University of Auckland Bachelor of Science
Linkedin: https://www.linkedin.com/in/glenn-thomas-0984a4310/
- War, Oil and Gold: Market Implications of the Latest Middle East Conflict - March 11, 2026
- Is the Gold Bull Market Over? What the Charts Say - March 4, 2026
- Gold: Under-Owned, Under-Positioned — and Still Misunderstood? - February 18, 2026
I agree that the ratio is too high but don’t know how to take advantage of this except by buying more silver than gold. Is selling gold futures and buying silver futures a safe way of achieving the same thing…how about margin calls, commission rates etc…I don’t know much about futures trading
Regards
Paul
I too believe that silver is lagging gold but sometime in the next couple of years there will be a catch up period. The maths is simple…if gold rises from is current $1250 USD to say $2000 USD with a current GSR of 83 (60% increase) then a drop in the GSR to say 60 would see the silver spot go from its current $15.15 USD to $33.33 USD (120% increase).
In my view, a 33% gold vs 66% silver investment ratio is a safe approach rather than putting all the eggs in the silver basket.
Can’t argue with that theory Stuart. Silver does seem to have plenty of upside from here. And yes indeed best not to have all eggs in one basket.
Thanks for commenting Paul. We prefer the method of buying more silver than gold too at times like this. From a trading perspective then yes buying futures or even Exchange Traded Funds (ETF’s) could be profitable on a more short term horizon. But yes you’d need to take commissions into account and only “play” with what you can afford to lose as silver can be volatile for sure!.
Pingback: Gold to Silver Ratio Update for 2017: Time to Buy Silver Again - Gold Survival Guide
Pingback: Silver’s Relationship to Interest Rates + How High Might it Go?
Pingback: What to Make of Legal Tender (Face Value) Gold and Silver Coins? - Gold Survival Guide
Pingback: Gold & Silver in NZ Dollars: 2016 in Review & Our Guess For 2017 - Gold Survival Guide
Pingback: Could Silver Be Worth More Than Gold? - Gold Survival Guide
Pingback: The Gold-Silver Ratio – Another Look
Pingback: Is Silver a Better Value than Gold Right Now? - Gold Survival Guide
Pingback: Interesting Historical Comparisons in the Valuation of Silver
Pingback: Have We Seen the Bottom for Silver in NZD?
Pingback: NZD Silver Bottom is Here - Technical and Sentiment Analysis - Gold Survival Guide
Pingback: Gold and Silver ChartFest - Update for 2016 - Gold Survival Guide
Pingback: NZD Gold and Silver Update: Is the Bottom in this Time?
Pingback: Ronald Stoeferle: 2016 Will Be a Good Year For Gold Investors
Pingback: Gold to Silver Ratio: What Can We Expect Now After QE3?
Pingback: Gold Silver Ratio: Silver Ready to Rise Versus Gold?
Pingback: Should I Buy Gold or Silver? 7 Factors to Consider in Gold vs Silver - Gold Survival Guide
Pingback: Why Buy Silver? Here's 21 Reasons to Buy Silver Now
Pingback: Buy Silver in New Zealand
Pingback: When to Buy Gold or Silver: The Ultimate Guide (Updated) - Gold Survival Guide
Pingback: Gold Ratios Update: Dow/Gold, NZ Housing to Gold, & Gold/Silver Ratio - Jan 2019 - Gold Survival Guide
Pingback: Why Buffett is (Still) Wrong About Gold - But How He Loves Silver - Gold Survival Guide
Pingback: Gold in NZ Dollars Hits New 6 Year Record High - Gold Survival Guide
Pingback: NZD Gold Above $2000 - Should You Buy the Breakout? - Gold Survival Guide
Pingback: Reader Comment on Property versus Gold - Has Gold Really Performed That Well? - Gold Survival Guide
Pingback: How to Swap Gold for Silver - Taking Advantage of the Record High Gold Silver Ratio - Gold Survival Guide
Pingback: Bank Economists Change Their Tune - Again - Gold Survival Guide
Pingback: Learn how to Put money into a Recession the Proper Approach – FinanceDay
Pingback: RBNZ Joins the Fed in the Race to The Bottom! - Gold Survival Guide
Pingback: Update on Bullion in New Zealand Post Lock Down - Gold Survival Guide
Pingback: Is it Too Late to Buy Gold? [Video] - Gold Survival Guide
Pingback: Silver Plunges 8% Overnight But Still Up 5% on a Week Ago - Gold Survival Guide
Pingback: International Reaction to Russian Invasion to Speed Up the End of the US Dollar Reserve Currency System? - Gold Survival Guide
Pingback: The Queens Death and N.Z. Currency - Gold Survival Guide
Pingback: What Price Could Silver Reach? - Gold Survival Guide
Pingback: Higher Interest Bill = Bank Reserves Becoming More Imperiled - Gold Survival Guide